Potree for the win!
I'm a little (6 years+) late to the party but wow, it's great to finally get stuck into the awesome power of Potree. Potree is a WebGL powered pointcloud viewer which enables the blazingly fast client side rendering of pointclouds of the type usually generated by LIDAR or Photogrammetry, right here in your browser. The good news is that the successor to Potree 1.8, Potree-Next is currently under active development. Potree-Next is a rewrite of Potree in WebGPU, the upcoming succesor of WebGL. For now, however, we can enjoy the impressive functionality of the original Potree.
Check out a full page version here
Although Potree is super fast and just looks, well awesome in a lo-fi, kind of 8-bit way, I think what really makes it the best is the seamless way you can add real geographical context to your pointclouds in the form of backdrop web mapping tiles, proper, georeferenced vector data and annotations, and beautifully rendered high-resolution raster imagery. I'm by no means an expert on the capabilities of, say Sketchfab, but I've always been underwhelmed by the lack of wider context for many of the (admiteddly brilliantly rendered) models that I've come across on that platform. For me, setting your pointcloud data into its wider geographic context and or annotating it using open-standards based vector data can really unlock its true potential and wonder, especially if you plan to use it to better understand the wider landscape.
I thought I'd share a short overview of the steps necessary for implementing Potree on this site, using a pointcloud of the Danes Dyke that I obtained a few years back using a DJI Matrice 2 with an L1 sensor. After battling through the unpleasantly propriety DJI Terra software to produce a nice shiny .las file of my point cloud I followed the following process.
The first step was to clone the repositories for Potree and PotreeConverter using git.
git clone https://github.com/LeftOfHere/PotreeConverter
git clone https://github.com/potree/potree.git
My work machine is a MacBook Air M2 running MacOSX Sonoma 14.8.3, so I used the fork of PotreeConverter shown above, which seemingly has better support for compilation on Macs with ARM-based Apple silicon chips than the original repository. I compiled PotreeConverter following the handy instructions on the README.md—the only slightly unusual step I took was to install an older version of Cmake into a custom micromamba environment, as the relative age of the software means that it won't compile on the latest version of Cmake. You could equally use conda or mamba but I prefer micromamba for its sheer speed and portability.
micromamba create -n potreeconverter -c conda-forge
micromamba activate potreeconverter
micromaba install cmake==3.16
cd PotreeConverter
mkdir build
cd build
cmake ../
make
All being well, you should have a freshly compiled binary of PotreeConverter, which you can use to convert your las file to Potree's preferred format using:
cd build
./PotreeConverter -i mylas.las -o danes
This yields a collection of files within the folder specified using the -o flag, like so:
cd danes
tree
.
├── hierarchy.bin
├── log.txt
├── metadata.json
└── octree.bin
These are the files that we will point the actual potree.js library call at. Handily, this is all done purely within the HTML of the webpage serving the viewer. However, before I deployed I first needed to build potree and install its dependencies. This process is detailed on the official repository, however in essence you will need a working version of node.js. Given I was deploying this to a production site, I decided to address the security vulnerabilities identified during installation by using the somewhat risky npm audit fix --force command. This force updates the specified dependencies (which are older due to the relative age of Potree at this point) to modern, safer versions but runs the risk of breaking the overall functionality. Fortunately, Potree still functioned and I was able to run Potree locally using the npm start command. This was very handy as it allowed me to browse all of the included examples and test configurations before deploying them. This is especially useful given that the online examples page is a little broken after so many years but a couple do still work. Check out these cool examples with a predefined elevation profile and Cesium mapping backdrop layer.
The next step is to upload the Potree repository, or at least the ./libs and ./builds directories, and the newly converted pointcloud files to the web server. In my case, I uploaded the large (4GB+) octree.bin and associated pointcloud files to an networked volume attached to the virtual machine serving my website. Separating out this heavy data from the general, lightweight website HTML, JS and CSS files reduces the overall size of the Docker image used to build the server and thus keeps deployment of the site nice and fast.
Perhaps I've been unable to locate the documentation but the one slight wrinkle in deploying Potree was a lack of comprehensive documentation outlining all the different options possible within the HTML JS declarations. In lieu of this, I was left scrabbling around the provided examples and spent longer than I would have liked experimenting (with the help of various LLMs) with different chunks of configuration and syntax. I'm not experienced with JS at all, and this was by far and away the most time-consuming aspect of the process. You can view the whole page source via your browser's developer tools but one of my favourite elements was created using the following lines:
    // define sphere material and size
	let sphere = new THREE.Mesh(
		new THREE.SphereGeometry(8, 16, 16),
		new THREE.MeshNormalMaterial()
	);
	potreeViewer.scene.scene.add(sphere);

...

{ // create Animation Path & make light follow it

			let path = [[686789.3081,6000088.2813,180.4491],\
            [686796.5575,6000088.4245,180.5199],\
            [686795.4006,6000102.0261,180.3976],\
            ...,\
            [686530.1835,6000410.6785,180.8635],\
            [686531.3931,6000383.656,180.8585],\
            [686531.147,6000388.7931,180.8673]]
				.map(v => new THREE.Vector3(...v));

			let animationPath = new Potree.AnimationPath(path);
			animationPath.closed = true;

			{ // render the path
				let geometry = animationPath.getGeometry();
				let material = new THREE.LineBasicMaterial({color: 0xff0000});
				let line = new THREE.Line(geometry, material);
				potreeViewer.scene.scene.add(line);
			}

			{ // render the control points of the path
				for(let pos of path){
					let sg = new THREE.SphereGeometry(0.2, 32, 32);
					let sm = new THREE.MeshBasicMaterial({color: 0xff0000});
					let s = new THREE.Mesh(sg, sm);
					s.position.copy(pos);
					potreeViewer.scene.scene.add(s);
				}
			}

			{ // Animate from beginning to end, setting a constant speed value
				let start = 0;
				let end = Infinity;
				let speed = 200;
				let animation = animationPath.animate(start, end, speed, t => {
					animation.repeat = true;

					// t is a value between 0 and 1.
					// use getPoint(t) to map from t to the position on the animation path
					let point = animation.getPoint(t);
					sphere.position.copy(point);
				});
				window.animation = animation;
			}

			window.animationPath = animationPath;
		}
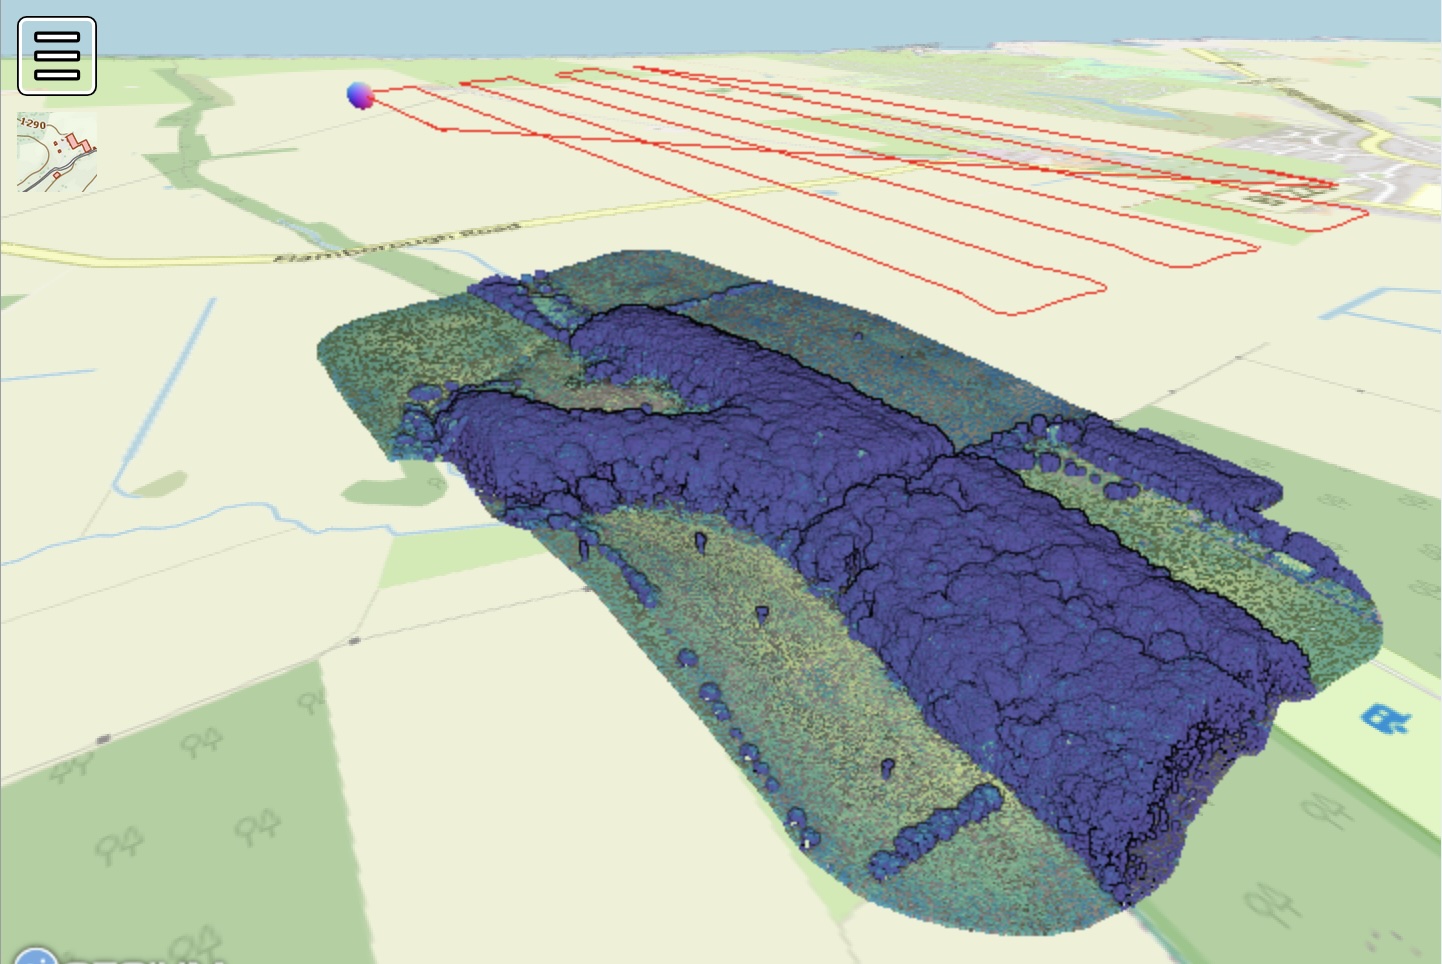
These chunks of code are what render the cool looking floating orb that you can see meandering above the point cloud. But what is that orb? Well, those of you familiar with UAV survey might recognise that path as the kind of flight path commonly used to capture survey data using a UAV. After a failed attempt to parse flight log data using pure JS, I ended up preprocessing the data in R and feeding it manually into the HTML. So the path you see is in fact (a subsampled version of) the recorded flight path of the UAV, complete with accurate elevation and geographic coordinates. It's perhaps a bit of a gimmick but it does allow me to look at how the chosen flight path may have influenced data collection, in particular how it related to gaps in my survey of the earthwork, so has some value in terms of learning I think.